
Page 47 - HRC_Annual_Report_2023
P. 47
Financial Reports &
Governance Other Information HENGYUAN REFINING COMPANY BERHAD l ANNUAL REPORT 2023 45
FY2023 KEY PERFORMANCE
INDICATORS (KPIs)
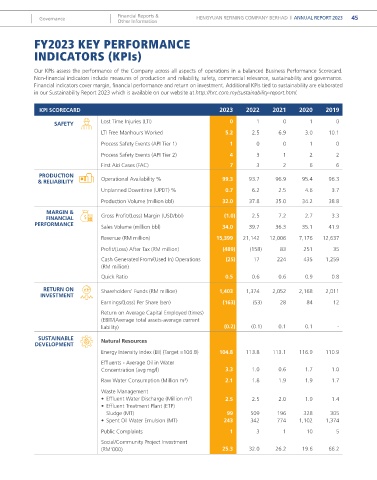
Our KPIs assess the performance of the Company across all aspects of operations in a balanced Business Performance Scorecard.
Non-financial indicators include measures of production and reliability, safety, commercial relevance, sustainability and governance.
Financial indicators cover margin, financial performance and return on investment. Additional KPIs tied to sustainability are elaborated
in our Sustainability Report 2023 which is available on our website at http://hrc.com.my/sustainability-report.html.
KPI SCORECARD 2023 2022 2021 2020 2019
SAFETY Lost Time Injuries (LTI) 0 1 0 1 0
LTI Free Manhours Worked 5.2 2.5 6.9 3.0 10.1
Process Safety Events (API Tier 1) 1 0 0 1 0
Process Safety Events (API Tier 2) 4 3 1 2 2
First Aid Cases (FAC) 7 3 2 6 6
PRODUCTION
& RELIABILITY Operational Availability % 99.3 93.7 96.9 95.4 96.3
Unplanned Downtime (UPDT) % 0.7 6.2 2.5 4.6 3.7
Production Volume (million bbl) 32.0 37.8 35.0 34.2 38.8
MARGIN &
FINANCIAL Gross Profit/(Loss) Margin (USD/bbl) (1.0) 2.5 7.2 2.7 3.3
PERFORMANCE Sales Volume (million bbl) 34.0 39.7 36.3 35.1 41.9
Revenue (RM million) 15,399 21,142 12,006 7,176 12,637
Profit/(Loss) After Tax (RM million) (489) (158) 83 251 35
Cash Generated From/(Used In) Operations (25) 17 224 435 1,259
(RM million)
Quick Ratio 0.5 0.6 0.6 0.9 0.8
RETURN ON Shareholders’ Funds (RM million) 1,403 1,374 2,052 2,168 2,011
INVESTMENT
Earnings/(Loss) Per Share (sen) (163) (53) 28 84 12
Return on Average Capital Employed (times)
(EBIT/(Average total assets-average current
liability) (0.2) (0.1) 0.1 0.1 -
SUSTAINABLE Natural Resources
DEVELOPMENT
Energy Intensity Index (EII) (Target =106.8) 104.8 113.8 113.1 116.9 110.9
Effluents - Average Oil in Water
Concentration (avg mg/l) 3.3 1.0 0.6 1.7 1.0
3
Raw Water Consumption (Million m ) 2.1 1.8 1.9 1.9 1.7
Waste Management
• Effluent Water Discharge (Million m ) 2.5 2.5 2.0 1.9 1.4
3
• Effluent Treatment Plant (ETP)
Sludge (MT) 99 509 196 328 305
• Spent Oil Water Emulsion (MT) 243 342 774 1,102 1,374
Public Complaints 1 3 1 10 5
Social/Community Project Investment
(RM‘000) 25.3 32.0 26.2 19.6 66.2